|
|
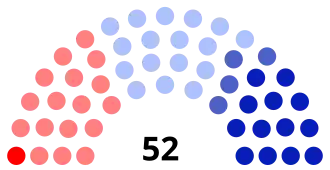
| Élections cantonales de 1985 dans le Finistère |
| 27 des 52 cantons du Finistère |
| les et |
| Type d’élection |
Élections cantonales |
| Corps électoral et résultats |
| Inscrits |
326 844 |
| Votants au 1er tour |
222 662 |
|
68,12 % |
| Votes exprimés au 1er tour |
217 800 |
| Votants au 2d tour |
182 888 |
|
68,07 % |
| Votes exprimés au 2d tour |
176 570 |
|
 |
UDF – Louis Orvoën |
|
| Voix au 1er tour |
116 398 |
|
| 53,45 % |
|
| Voix au 2e tour |
101 487 |
|
| 57,48 % |
|
| Sièges obtenus |
34 |
 6 6 |
|
 |
PS – Pierre Maille |
Opposition départementale
|
| Voix au 1er tour |
65 880 |
|
| 30,24 % |
|
| Voix au 2e tour |
71 051 |
|
| 40,24 % |
|
| Sièges obtenus |
18 |
 3 3 |
| Conseil général après élection |
|
Avant - PCF : 1 siège
- PS : 20 sièges
- UDF : 16 sièges
- CNIP-DVD : 3 sièges
- RPR : 9 sièges
|
Après - PCF : 1 siège
- PS : 17 sièges
- UDF et app : 17 sièges
- DVD-RPR : 4 sièges
- RPR : 13 sièges
|
| Président du conseil général |
| Sortant |
Élu |
Louis Orvoën
CDS |
Louis Orvoën
CDS |
| Site du conseil général du Finistère |
Les élections cantonales françaises de 1985 ont eu lieu les et .
Contexte départemental
Assemblée départementale sortante
Résultats à l’échelle du département
Résultats départementaux des élections cantonales de 1985 dans le Finistère.
| Étiquette |
Premier tour |
Second tour |
Sièges |
| Voix |
% |
Voix |
% |
| |
Parti socialiste |
64 476 |
29,60 |
71 051 |
40,24 |
8 |
| |
Parti communiste français |
18 386 |
8,44 |
4 032 |
2,28 |
0 |
| |
Union démocratique bretonne |
3 302 |
1,52 |
| |
Divers gauche |
1 404 |
0,64 |
| |
Extrême gauche |
128 |
0,06 |
| Gauche |
87 696 |
40,26 |
75 083 |
42,52 |
8 |
|
| |
Union pour la démocratie française |
55 420 |
25,45 |
47 466 |
26,88 |
9 |
| |
Rassemblement pour la République |
45 630 |
20,95 |
42 483 |
24,06 |
9 |
| |
Divers droite |
15 348 |
7,05 |
11 538 |
6,53 |
1 |
| |
Front national |
12 657 |
5,81 |
|
| Droite |
129 183 |
59,25 |
101 487 |
57,48 |
19 |
|
| |
Divers |
1 049 |
0,48 |
|
| Inscrits |
326 844 |
100,00 |
268 692 |
100,00 |
|
| Votants |
222 662 |
68,12 |
182 888 |
68,07 |
| Exprimés |
217 800 |
66,64 |
176 570 |
65,71 |
Résultats en nombre de sièges
| Parti | Sièges mis en jeu | Élus | Évolution |
|---|
| PS | 11 | 8 | -3 |
| RPR | 3 | 9 | +6 |
| UDF | 10 | 10 | = |
Assemblée départementale élue
Le nombre de cantons passe de 49 à 52.
Liste des élus
*Conseillers généraux sortants ne se représentant pas
Résultats par canton
Canton d'Arzano
Résultats
| Candidats |
Étiquette |
Premier tour |
Second tour |
| Voix |
% |
Voix |
% |
|
Georges Dauphin * |
PS |
1 241 |
43,20 |
1 586 |
53,24 |
|
Michel Balanant |
UDF-CDS |
778 |
27,08 |
1 393 |
46,76 |
|
Pierre Calvar |
DVD-RPR |
595 |
20,71 |
Retrait |
|
Louis Rousseau |
PCF |
173 |
6,02 |
|
Albert Chrismann |
FN |
86 |
2,99 |
|
| Inscrits |
3 527 |
100,00 |
3 527 |
100,00 |
| Votants |
2 917 |
82,71 |
3 026 |
85,80 |
| Exprimés |
2 873 |
98,49 |
2 979 |
95,48 |
*sortant
Canton de Bannalec
Pierre Boëdec (PS) élu depuis 1961 ne se représente pas.
Résultats
| Candidats |
Étiquette |
Premier tour |
Second tour |
| Voix |
% |
Voix |
% |
|
Yvon Le Bris |
PS (*) |
1 930 |
38,96 |
2 929 |
57,66 |
|
Guy Lozachmeur |
RPR |
1 669 |
33,69 |
2 151 |
42,34 |
|
Jean-Yves Cochennec |
PCF |
897 |
18,11 |
Retrait |
|
Guy Flégéo |
App.FLB |
283 |
5,71 |
|
Philippe Le Roux |
FN |
175 |
3,53 |
|
| Inscrits |
6 920 |
100,00 |
6 914 |
100,00 |
| Votants |
5 030 |
72,69 |
5 205 |
75,28 |
| Exprimés |
4 954 |
98,49 |
5 080 |
97,60 |
Canton de Brest-I
Résultats
| Candidats |
Étiquette |
Premier tour |
Second tour |
| Voix |
% |
Voix |
% |
|
Marcel Le Floch |
RPR |
4 380 |
44,88 |
5 314 |
52,02 |
|
Yvette Duval * |
PS |
3 885 |
39,81 |
4 900 |
47,98 |
|
Armelle Rello |
FN |
777 |
7,96 |
|
Yvon Pichavant |
PCF |
717 |
7,35 |
|
| Inscrits |
16 139 |
100,00 |
16 139 |
100,00 |
| Votants |
10 022 |
62,10 |
10 456 |
64,79 |
| Exprimés |
9 759 |
97,38 |
10 214 |
97,69 |
*sortant
Canton de Brest-II
Francis Le Blé (PS) est mort en 1982 , Guy-René Leclercq (RPR) a été élu lors de la partielle qui a suivi.
Résultats
| Candidats |
Étiquette |
Premier tour |
Second tour |
| Voix |
% |
Voix |
% |
|
Guy-René Leclercq * |
RPR |
3 396 |
42,96 |
4 090 |
49,78 |
|
Pierre Maille |
PS |
3 044 |
38,50 |
4 126 |
50,22 |
|
Louis Le Roux |
PCF |
795 |
10,06 |
|
Jean-Marie Lebraud |
FN |
601 |
7,60 |
|
Christophe Inizan |
LCR |
70 |
0,89 |
|
| Inscrits |
14 340 |
100,00 |
14 340 |
100,00 |
| Votants |
8 061 |
56,21 |
8 354 |
58,26 |
| Exprimés |
7 906 |
98,08 |
8 216 |
98,35 |
*sortant
Canton de Brest-IV
Résultats
| Candidats |
Étiquette |
Premier tour |
Second tour |
| Voix |
% |
Voix |
% |
|
Georges Lombard * |
App.UDF |
4 595 |
45,65 |
5 493 |
53,56 |
|
Jean-Pierre Hue |
PS |
3 544 |
35,21 |
4 763 |
46,44 |
|
Robert Lesieur |
FN |
1 006 |
10,00 |
|
Jean Salaud |
PCF |
616 |
6,12 |
|
Jean Guegueniat |
FB-UDB |
304 |
3,02 |
|
| Inscrits |
17 807 |
100,00 |
17 807 |
100,00 |
| Votants |
10 274 |
57,70 |
10 496 |
58,94 |
| Exprimés |
10 065 |
97,97 |
10 256 |
97,69 |
*sortant
Canton de Brest-VI
Marie-Jacqueline Desouches (PS) élu depuis 1973 se représente dans le nouveau canton de Brest-VIII.
Résultats
| Candidats |
Étiquette |
Premier tour |
Second tour |
| Voix |
% |
Voix |
% |
|
Daniel Abiven |
PS (*) |
2 433 |
34,93 |
3 704 |
52,33 |
|
André Rosec |
UDF-CDS |
2 423 |
34,78 |
3 374 |
47,67 |
|
Alain Poupon |
DVD-RPR |
757 |
10,87 |
|
Henri Hofmann |
FN |
566 |
8,13 |
|
Annie Le Gall |
PCF |
522 |
7,49 |
|
Jean-Claude Le Fell |
PT |
153 |
2,20 |
|
Pierre Fourel |
UDB |
112 |
1,61 |
|
| Inscrits |
12 891 |
100,00 |
12 891 |
100,00 |
| Votants |
7 103 |
55,10 |
7 289 |
56,54 |
| Exprimés |
6 966 |
98,07 |
7 078 |
97,11 |
Nouveau canton de Brest-VII
Résultats
| Candidats |
Étiquette |
Premier tour |
Second tour |
| Voix |
% |
Voix |
% |
|
Jacques Berthelot |
RPR |
4 853 |
49,79 |
5 520 |
56,69 |
|
Jean Mobian |
PS |
3 464 |
35,61 |
4 218 |
43,31 |
|
Bernard Pacreau |
FN |
902 |
9,27 |
|
Raymond Kelhetter |
PCF |
517 |
5,31 |
|
| Inscrits |
15 241 |
100,00 |
15 239 |
100,00 |
| Votants |
10 069 |
66,07 |
10 044 |
65,91 |
| Exprimés |
9 736 |
96,59 |
9 738 |
96,95 |
Nouveau canton de Brest-VIII
Marie-Jacqueline Desouches (PS) élu depuis 1973 dans le Canton de Brest-VI se représente dans ce nouveau canton.
Résultats
| Candidats |
Étiquette |
Premier tour |
Second tour |
| Voix |
% |
Voix |
% |
|
Jean-Yves Le Borgne |
UDF |
2 602 |
42,30 |
3 126 |
49,52 |
|
Marie-Jacqueline Desouches (*) |
PS |
2 354 |
38,27 |
3 186 |
50,48 |
|
Yvonne Lagadec |
PCF |
662 |
10,76 |
|
Louis Jézéquel |
FN |
533 |
8,67 |
|
| Inscrits |
11 748 |
100,00 |
11 748 |
100,00 |
| Votants |
6 301 |
53,64 |
6 450 |
54,90 |
| Exprimés |
6 151 |
97,62 |
6 312 |
97,86 |
Canton de Carhaix-Plouguer
Résultats
| Candidats |
Étiquette |
Premier tour |
Second tour |
| Voix |
% |
Voix |
% |
|
Jean Rohou * |
DVD-UDF |
3 169 |
32,84 |
5 340 |
56,98 |
|
André Le Roux |
UDF-CDS |
1 905 |
19,74 |
Retrait |
|
Désiré Mahé |
PCF |
1 756 |
18,18 |
4 032 |
43,02 |
|
François Garo |
PS |
1 640 |
17,00 |
Retrait |
|
Yves Rémond |
UDB |
892 |
9,25 |
|
Joseph Boulic |
FN |
287 |
2,97 |
|
| Inscrits |
12 912 |
100,00 |
12 912 |
100,00 |
| Votants |
9 812 |
75,99 |
9 941 |
76,99 |
| Exprimés |
9 649 |
98,34 |
9 372 |
94,28 |
*sortant
Canton de Concarneau
Résultats
| Candidats |
Étiquette |
Premier tour |
Second tour |
| Voix |
% |
Voix |
% |
|
Paulette Lecroc |
DVD-UDF |
5 044 |
40,63 |
6 198 |
48,85 |
|
Gilbert Le Bris* |
PS |
4 003 |
32,25 |
6 491 |
51,15 |
|
Yvon Quéroué |
PCF |
2 652 |
21,36 |
Retrait |
|
Dominique Tingaud |
FN |
715 |
5,76 |
|
| Inscrits |
18 799 |
100,00 |
18 796 |
100,00 |
| Votants |
12 751 |
67,83 |
13 090 |
69,64 |
| Exprimés |
12 414 |
97,36 |
12 689 |
96,94 |
*sortant
Canton de Crozon
Résultats
| Candidats |
Étiquette |
Premier tour |
Second tour |
| Voix |
% |
Voix |
% |
|
Jean-Jacques Fabien |
RPR |
3 976 |
47,58 |
4 802 |
51,77 |
|
Claude Yvenat * |
PS |
3 549 |
42,47 |
4 473 |
48,23 |
|
Stéphane Le Fur |
FN |
578 |
6,92 |
|
Pierre Plougonven |
PCF |
254 |
3,04 |
|
| Inscrits |
12 970 |
100,00 |
12 964 |
100,00 |
| Votants |
8 487 |
65,47 |
9 423 |
72,69 |
| Exprimés |
8 357 |
98,47 |
9 275 |
98,43 |
*sortant
Canton de Daoulas
Résultats
| Candidats |
Étiquette |
Premier tour |
| Voix |
% |
|
Joseph Malléjac * |
UDF-AD |
5 031 |
53,76 |
|
Joseph Salaün |
PS |
2 740 |
29,28 |
|
Robert Galci |
FN |
834 |
8,91 |
|
André Le Gac |
PCF |
753 |
8,05 |
|
| Inscrits |
15 003 |
100,00 |
| Votants |
9 745 |
64,95 |
| Exprimés |
9 358 |
96,03 |
*sortant
Canton de Fouesnant
Louis Le Calvez (UDF-CDS) élu depuis 1955 ne se représente pas.
Résultats
| Candidats |
Étiquette |
Premier tour |
Second tour |
| Voix |
% |
Voix |
% |
|
Roger Le Goff[1] |
UDF-CDS (*) |
2 243 |
23,24 |
5 482 |
59,39 |
|
Gérard Mével |
PS |
2 083 |
21,58 |
3 749 |
40,61 |
|
Jean-François Garrec |
RPR |
1 490 |
15,44 |
Retrait |
|
Corentin Renot |
DVD-RPR |
966 |
10,01 |
|
Jean L'Hénoret |
DVD-UDF |
838 |
8,68 |
|
Claudine Dupont-Tingaud |
FN |
701 |
7,26 |
|
Jean-Yves Mazo |
PCF |
528 |
5,47 |
|
Joseph Chiquet |
MRG |
426 |
4,41 |
|
Pierre Delignière |
Verts |
376 |
3,90 |
|
| Inscrits |
13 379 |
100,00 |
13 375 |
100,00 |
| Votants |
9 836 |
73,52 |
9 625 |
71,96 |
| Exprimés |
9 651 |
98,12 |
9 231 |
95,91 |
Canton de Guilvinec
Jean Folgoas (PS) est le dernier élu de l'ancien Canton de Pont-l'Abbé.
Ce canton en regroupe la moitié sud et maritime.
Résultats
| Candidats |
Étiquette |
Premier tour |
Second tour |
| Voix |
% |
Voix |
% |
|
Pierre Draoulec |
App.UDF-CDS |
4 261 |
39,83 |
6 362 |
56,61 |
|
Jean Folgoas * |
PS |
2 862 |
26,75 |
4 876 |
43,39 |
|
Guy Laurent |
PCF |
1 427 |
13,34 |
|
Dominique Tanguy |
DVD-RPR |
722 |
6,75 |
|
Jean-Jérôme Le Coq |
MRG |
578 |
5,40 |
|
Roger Abasq |
FN |
443 |
4,14 |
|
Théodore Perrot |
UDB |
405 |
3,79 |
|
| Inscrits |
16 022 |
100,00 |
16 018 |
100,00 |
| Votants |
10 949 |
68,34 |
11 632 |
72,62 |
| Exprimés |
10 698 |
97,71 |
11 238 |
96,61 |
*sortant
Canton de Lanmeur
Résultats
| Candidats |
Étiquette |
Premier tour |
Second tour |
| Voix |
% |
Voix |
% |
|
Jean-René Cadran * |
PS |
2 642 |
38,15 |
4 224 |
59,97 |
|
Romain Guillou |
UDF-CDS |
1 109 |
16,01 |
2 819 |
40,03 |
|
Yves Mériadec |
RPR |
1 086 |
15,68 |
Retrait |
|
Jean-Yves Lainé |
PCF |
1 081 |
15,61 |
Retrait |
|
Jacques Normand |
PSU |
400 |
5,78 |
|
Jean Le Saux |
FN |
283 |
4,09 |
|
Hervé Louis-Calixte |
CNIP-EXD |
276 |
3,99 |
|
André Mouton |
DVD |
49 |
0,71 |
|
| Inscrits |
9 439 |
100,00 |
9 439 |
100,00 |
| Votants |
7 042 |
74,61 |
7 232 |
76,62 |
| Exprimés |
6 926 |
98,35 |
7 043 |
97,39 |
*sortant
Canton de Lannilis
Résultats
| Candidats |
Étiquette |
Premier tour |
Second tour |
| Voix |
% |
Voix |
% |
|
Léon Guéguen * |
UDF-PR |
3 785 |
45,99 |
4 144 |
100,00 |
|
Jean-Michel Perhirin |
RPR |
2 569 |
31,21 |
Retrait |
|
Gilbert Bellec |
PS |
895 |
10,87 |
|
Jean-François Kervern |
POBL |
487 |
5,92 |
|
Claude Hermann |
FN |
339 |
4,12 |
|
Marie-France Pellennec |
PCF |
156 |
1,90 |
|
| Inscrits |
11 207 |
100,00 |
11 201 |
100,00 |
| Votants |
8 351 |
74,52 |
5 399 |
48,20 |
| Exprimés |
8 231 |
98,56 |
4 144 |
76,76 |
*sortant
Canton de Plabennec
Jean-Louis Goasduff (RPR), élu depuis 1973 ne se représente pas.
Résultats
| Candidats |
Étiquette |
Premier tour |
| Voix |
% |
|
Louis Coz |
RPR (*) |
5 761 |
70,57 |
|
Gabriel Le Jeune |
PS |
1 574 |
19,28 |
|
Françine Porzier |
FN |
504 |
6,17 |
|
Yvon Drévillon |
PCF |
325 |
3,98 |
|
| Inscrits |
11 443 |
100,00 |
| Votants |
8 408 |
73,48 |
| Exprimés |
8 164 |
97,10 |
Canton de Pleyben
Résultats
| Candidats |
Étiquette |
Premier tour |
Second tour |
| Voix |
% |
Voix |
% |
|
Jean-Jacques Pirche |
RPR |
2 253 |
41,90 |
3 239 |
60,85 |
|
François Philippot * |
PS |
1 400 |
26,04 |
2 084 |
39,15 |
|
Christian Savidan |
App.UDF |
1 273 |
23,68 |
Retrait |
|
Raymond Dorval |
PCF |
294 |
5,47 |
|
Gabriel Mazeo |
FN |
157 |
2,92 |
|
| Inscrits |
7 165 |
100,00 |
7 161 |
100,00 |
| Votants |
5 469 |
76,37 |
5 438 |
75,94 |
| Exprimés |
5 377 |
98,32 |
5 323 |
97,89 |
*sortant
Canton de Ploudalmézeau
Résultats
| Candidats |
Étiquette |
Premier tour |
Second tour |
| Voix |
% |
Voix |
% |
|
Alphonse Arzel * |
UDF-CDS |
2 925 |
35,99 |
3 856 |
48,71 |
|
Édouard Talarmin |
DVD-RPR |
2 743 |
33,75 |
4 061 |
51,29 |
|
Jeanne Pellen |
PS |
900 |
11,07 |
|
Pierre L'Hénaff |
DVD-RPR |
632 |
7,78 |
|
Patrick de Poulpiquet |
FN |
454 |
5,59 |
|
René Treguer |
UDB |
322 |
3,96 |
|
Michel Person |
PCF |
151 |
1,86 |
|
| Inscrits |
10 934 |
100,00 |
10 932 |
100,00 |
| Votants |
8 309 |
75,99 |
8 370 |
76,56 |
| Exprimés |
8 127 |
97,81 |
7 917 |
94,59 |
*sortant
Canton de Plouescat
Résultats
| Candidats |
Étiquette |
Premier tour |
| Voix |
% |
|
Yves Priser* |
App.UDF-CDS |
3 550 |
70,59 |
|
Jean-François Le Jeune |
PS |
1 101 |
21,89 |
|
Pierre Cote |
FN |
276 |
5,49 |
|
Emmanuel Charles |
PCF |
102 |
2,03 |
|
| Inscrits |
7 213 |
100,00 |
| Votants |
5 151 |
71,41 |
| Exprimés |
5 029 |
97,63 |
*sortant
Canton de Plouzévédé
Résultats
| Candidats |
Étiquette |
Premier tour |
| Voix |
% |
|
Jacques de Menou * |
UDF |
3 699 |
65,37 |
|
Jean-Luc Urien ou Uguen |
PS |
1 599 |
28,26 |
|
Gérard Larrieu |
FN |
196 |
3,46 |
|
Guy Kerbrat |
PCF |
165 |
2,92 |
|
| Inscrits |
7 325 |
100,00 |
| Votants |
5 748 |
78,47 |
| Exprimés |
5 659 |
98,45 |
*sortant
Canton de Pont-Croix
Résultats
| Candidats |
Étiquette |
Premier tour |
Second tour |
| Voix |
% |
Voix |
% |
|
Henri Cogan * |
UDF-CDS |
3 952 |
35,20 |
6 485 |
56,23 |
|
Jean Normant |
PS |
3 677 |
32,75 |
5 048 |
43,77 |
|
Jean-Paul Coatmeur |
RPR |
2 293 |
20,42 |
Retrait |
|
Henri Donnart |
PCF |
796 |
7,09 |
|
Bruno Pensec |
FN |
509 |
4,53 |
|
| Inscrits |
17 119 |
100,00 |
17 112 |
100,00 |
| Votants |
11 469 |
67,00 |
11 838 |
69,18 |
| Exprimés |
11 227 |
97,89 |
11 533 |
97,42 |
*sortant
Canton de Pont-l'Abbé
Résultats
| Candidats |
Étiquette |
Premier tour |
| Voix |
% |
|
Sébastien Jolivet |
UDF-CDS |
4 513 |
54,37 |
|
Jean Richard * |
PS |
2 822 |
34,00 |
|
Roger Marzin |
PCF |
608 |
7,32 |
|
Henri Cuzon |
FN |
358 |
4,31 |
|
| Inscrits |
11 641 |
100,00 |
| Votants |
8 539 |
73,35 |
| Exprimés |
8 301 |
97,21 |
*sortant
Canton de Quimper-III
Résultats
| Candidats |
Étiquette |
Premier tour |
Second tour |
| Voix |
% |
Voix |
% |
|
Bernard Poignant |
PS |
3 162 |
32,24 |
4 847 |
49,37 |
|
Alain Gérard |
RPR |
2 129 |
21,71 |
4 971 |
50,63 |
|
André Paubert |
UDF-CDS |
1 792 |
18,27 |
Retrait |
|
François Cuzon |
DVD-RPR |
703 |
7,17 |
|
Étienne Perchec |
PCF |
613 |
6,25 |
|
Alain Uguen |
Verts |
520 |
5,30 |
|
Jean-Pierre Le Gris |
FN |
506 |
5,16 |
|
Joël Keranguyader |
DVD-RPR |
187 |
1,91 |
|
Patrice Le Cornec |
DVD-RPR |
137 |
1,40 |
|
André Garçon |
LCR |
58 |
0,59 |
|
| Inscrits |
15 058 |
100,00 |
15 058 |
100,00 |
| Votants |
10 032 |
66,62 |
10 129 |
67,27 |
| Exprimés |
9 807 |
97,76 |
9 818 |
96,93 |
Canton de Rosporden
Résultats
| Candidats |
Étiquette |
Premier tour |
Second tour |
| Voix |
% |
Voix |
% |
|
Gilbert Montfort * |
PS |
2 921 |
40,06 |
4 138 |
55,96 |
|
Édouard Launay |
RPR |
2 741 |
37,59 |
3 256 |
44,04 |
|
Francis Dufour |
PCF |
1 171 |
16,06 |
Retrait |
|
Élizabeth Boulic |
FN |
273 |
3,69 |
|
Paul Guéguéniat |
UDB |
185 |
2,54 |
|
| Inscrits |
9 427 |
100,00 |
9 428 |
100,00 |
| Votants |
7 435 |
78,87 |
7 599 |
80,60 |
| Exprimés |
7 291 |
98,06 |
7 394 |
97,30 |
*sortant
Canton de Saint-Pol-de-Léon
François Prigent (UDF-CDS) élu depuis 1949 ne se représente pas.
Résultats
| Candidats |
Étiquette |
Premier tour |
Second tour |
| Voix |
% |
Voix |
% |
|
Adrien Kervella |
DVD-RPR |
4 291 |
38,54 |
5 079 |
43,34 |
|
Michel Morvan |
UDF-CDS (*) |
4 147 |
37,25 |
4 932 |
42,08 |
|
Jean-Yves Pender |
PS |
1 791 |
16,09 |
1 709 |
14,58 |
|
Pierre d'Herbrais |
FN |
497 |
4,46 |
|
Jean-Pierre Creignou |
PCF |
407 |
3,67 |
|
| Inscrits |
15 693 |
100,00 |
15 691 |
100,00 |
| Votants |
11 301 |
72,02 |
11 852 |
75,53 |
| Exprimés |
11 133 |
98,51 |
11 720 |
98,89 |
Canton de Saint-Thégonnec
Résultats
| Candidats |
Étiquette |
Premier tour |
| Voix |
% |
|
Joseph Le Mer * |
DVD-UDF (ex CNIP) |
2 110 |
52,87 |
|
Jean-Claude Kerdilès |
PS |
1 220 |
30,57 |
|
Jean-Claude Faujour |
UDB |
312 |
7,82 |
|
Christian Billaut |
PCF |
248 |
6,21 |
|
Olivier Morize |
FN |
101 |
2,53 |
|
| Inscrits |
5 482 |
100,00 |
| Votants |
4 051 |
73,90 |
| Exprimés |
3 991 |
98,52 |
*sortant
Voir aussi
Liens externes
 Portail de la politique française
  Portail du Finistère
  Portail des années 1980