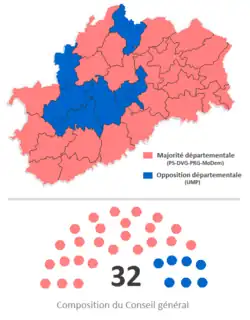
Résultats à l'échelle du département
Résultats départementaux des élections cantonales de 2008 dans la Haute-Saône.
| Étiquette |
Premier tour |
Second tour |
Total |
| Voix |
% |
Voix |
% |
|
Divers gauche |
16 061 |
23,29 |
10 108 |
39,14 |
6 |
|
Parti socialiste |
13 198 |
19,14 |
3 127 |
12,11 |
4 |
|
Parti radical de gauche |
2 086 |
3,02 |
|
1 |
|
Les Verts |
2 075 |
3,01 |
|
Parti communiste français |
1 972 |
2,86 |
| Gauche |
35 392 |
51,32 |
13 235 |
51,25 |
11 |
|
|
Union pour un mouvement populaire |
25 286 |
36,66 |
10 205 |
39,51 |
4 |
|
Front national |
4 035 |
5,85 |
837 |
3,24 |
0 |
|
Divers droite |
3 136 |
4,55 |
10 205 |
1,89 |
0 |
|
Mouvement démocrate |
1 028 |
1,49 |
1 062 |
4,11 |
1 |
| Droite |
33 485 |
48,55 |
22 309 |
48,75 |
5 |
|
|
Divers |
90 |
0,13 |
|
| Inscrits |
94 491 |
100,00 |
40 923 |
100,00 |
|
| Abstentions |
21 857 |
23,13 |
13 833 |
33,8 |
| Votants |
72 634 |
76,87 |
27 090 |
66,2 |
| Blancs et nuls |
3 667 |
5,05 |
1 264 |
4,67 |
| Exprimés |
68 967 |
94,95 |
25 826 |
95,33 |
Assemblée départementale à l'issue des élections
Résultats par canton
Canton de Gray
Résultats[1]
| Candidats |
Étiquette |
Premier tour |
Second tour |
| Voix |
% |
Voix |
% |
|
Patrice Debray * |
UMP |
2 825 |
44,51 |
2 655 |
45,92 |
|
Claudy Chauvelot-Duban |
PS |
2 550 |
40,18 |
3 127 |
54,08 |
|
Marcel Grognu |
FN |
658 |
10,37 |
|
Jean-Pierre Poinsot |
PCF |
314 |
4,95 |
|
| Inscrits |
9 417 |
100,00 |
9 418 |
100,00 |
| Abstentions |
2 810 |
29,84 |
3 440 |
36,53 |
| Votants |
6 607 |
70,16 |
5 978 |
63,47 |
| Blancs et nuls |
260 |
3,94 |
196 |
3,28 |
| Exprimés |
6 347 |
96,06 |
5 782 |
96,72 |
*sortant
Canton de Gy
Résultats[2]
| Candidats |
Étiquette |
Premier tour |
| Voix |
% |
|
Paul Cheviet * |
DVG |
1 687 |
56,07 |
|
Christelle Rousselle |
UMP |
1 322 |
43,93 |
|
| Inscrits |
3 762 |
100,00 |
| Abstentions |
618 |
16,43 |
| Votants |
3 144 |
83,57 |
| Blancs et nuls |
135 |
4,29 |
| Exprimés |
3 009 |
95,71 |
*sortant
Canton de Lure-Sud
Résultats[3]
| Candidats |
Étiquette |
Premier tour |
Second tour |
| Voix |
% |
Voix |
% |
|
Robert Morlot * |
DVG |
2 414 |
46,46 |
2 854 |
64,57 |
|
Claude Thiebaut |
FN |
785 |
15,11 |
837 |
18,94 |
|
Bernard Guilbert |
UMP |
769 |
14,80 |
729 |
16,49 |
|
Alain Genestier |
Verts |
533 |
10,26 |
|
René Morlot |
PCF |
427 |
8,22 |
|
Régis Durand |
MoDem |
268 |
5,16 |
|
| Inscrits |
7 467 |
100,00 |
7 467 |
100,00 |
| Abstentions |
2 039 |
27,31 |
2 852 |
38,19 |
| Votants |
5 428 |
72,69 |
4 615 |
61,81 |
| Blancs et nuls |
232 |
4,27 |
195 |
4,23 |
| Exprimés |
5 196 |
95,73 |
4 420 |
95,77 |
*sortant
Canton de Marnay
Résultats[4]
| Candidats |
Étiquette |
Premier tour |
| Voix |
% |
|
Maurice Fassenet * |
DVG |
1 979 |
57,43 |
|
Vincent Ballot |
DVD |
1 467 |
42,57 |
|
| Inscrits |
4 642 |
100,00 |
| Abstentions |
1 026 |
22,10 |
| Votants |
3 616 |
77,90 |
| Blancs et nuls |
170 |
4,70 |
| Exprimés |
3 446 |
95,30 |
*sortant
Canton de Mélisey
Résultats[5]
| Candidats |
Étiquette |
Premier tour |
| Voix |
% |
|
Rose-Marie Daviot * |
PRG |
2 086 |
51,05 |
|
Henri Saintigny |
UMP |
1 568 |
38,37 |
|
Jean-Marc Dalval |
Verts |
432 |
10,57 |
|
| Inscrits |
5 515 |
100,00 |
| Abstentions |
1 141 |
20,69 |
| Votants |
4 374 |
79,31 |
| Blancs et nuls |
288 |
6,58 |
| Exprimés |
4 086 |
93,42 |
*sortant
Canton de Pesmes
Résultats[6]
| Candidats |
Étiquette |
Premier tour |
Second tour |
| Voix |
% |
Voix |
% |
|
André Gauthier |
UMP |
912 |
33,32 |
981 |
38,77 |
|
Jean-Claude Gay |
MoDem |
760 |
27,77 |
1 062 |
41,98 |
|
Maxime Petigny |
DVD |
507 |
18,52 |
487 |
19,25 |
|
Simone Tupin |
PS |
468 |
17,10 |
Retrait |
|
Jean-Luc Merson |
DIV |
90 |
3,29 |
|
| Inscrits |
3 501 |
100,00 |
3 500 |
100,00 |
| Abstentions |
675 |
19,28 |
859 |
24,54 |
| Votants |
2 826 |
80,72 |
2 641 |
75,46 |
| Blancs et nuls |
89 |
3,15 |
111 |
4,20 |
| Exprimés |
2 737 |
96,85 |
2 530 |
95,80 |
*sortant
Canton de Port-sur-Saône
Résultats[7]
| Candidats |
Étiquette |
Premier tour |
| Voix |
% |
|
Jean-Paul Mariot * |
PS |
2 562 |
62,75 |
|
Franck Tisserand |
UMP |
1 521 |
37,25 |
|
| Inscrits |
5 627 |
100,00 |
| Abstentions |
1 248 |
22,18 |
| Votants |
4 379 |
77,82 |
| Blancs et nuls |
296 |
6,76 |
| Exprimés |
4 083 |
93,24 |
*sortant
Canton de Rioz
Résultats[8]
| Candidats |
Étiquette |
Premier tour |
| Voix |
% |
|
Yves Krattinger * |
PS |
3 416 |
68,46 |
|
Damien Mougin |
UMP |
1 574 |
31,54 |
|
| Inscrits |
6 399 |
100,00 |
| Abstentions |
1 155 |
18,05 |
| Votants |
5 244 |
81,95 |
| Blancs et nuls |
254 |
4,84 |
| Exprimés |
4 990 |
95,16 |
*sortant
Canton de Saint-Loup-sur-Semouse
Résultats[9]
| Candidats |
Étiquette |
Premier tour |
Second tour |
| Voix |
% |
Voix |
% |
|
Nadine Bathelot |
DVG |
2 736 |
36,79 |
3 949 |
57,56 |
|
Laurence Poinsot |
UMP |
2 184 |
29,37 |
2 912 |
42,44 |
|
Claude Grosjean |
DVD |
1 002 |
13,47 |
|
Anne-Marie Jeanmougin |
FN |
880 |
11,83 |
|
Michel Charaud |
Verts |
635 |
8,54 |
|
| Inscrits |
10 888 |
100,00 |
10 883 |
100,00 |
| Abstentions |
3 064 |
28,14 |
3 581 |
32,90 |
| Votants |
7 824 |
71,86 |
7 302 |
67,10 |
| Blancs et nuls |
387 |
4,95 |
441 |
6,04 |
| Exprimés |
7 437 |
95,05 |
6 861 |
93,96 |
*sortant
Canton de Saulx
Résultats[10]
| Candidats |
Étiquette |
Premier tour |
| Voix |
% |
|
Michel Weyermann * |
PS |
1 266 |
56,70 |
|
Christian Bresson |
UMP |
967 |
43,30 |
|
| Inscrits |
2 902 |
100,00 |
| Abstentions |
496 |
17,09 |
| Votants |
2 406 |
82,91 |
| Blancs et nuls |
173 |
7,19 |
| Exprimés |
2 233 |
92,81 |
*sortant
Canton de Scey-sur-Saône-et-Saint-Albin
Résultats[11]
| Candidats |
Étiquette |
Premier tour |
| Voix |
% |
|
Carmen Friquet * |
UMP |
2 462 |
59,31 |
|
Josiane Barbant Verrier |
PS |
1 220 |
29,39 |
|
Yves Marchois |
FN |
469 |
11,30 |
|
| Inscrits |
5 383 |
100,00 |
| Abstentions |
1 022 |
18,99 |
| Votants |
4 361 |
81,01 |
| Blancs et nuls |
210 |
4,82 |
| Exprimés |
4 151 |
95,18 |
*sortant
Canton de Vauvillers
Résultats[12]
| Candidats |
Étiquette |
Premier tour |
| Voix |
% |
|
Frédéric Laurent * |
UMP |
1 613 |
62,30 |
|
Élisabeth Touffu |
DVG |
976 |
37,70 |
|
| Inscrits |
3 340 |
100,00 |
| Abstentions |
586 |
17,54 |
| Votants |
2 754 |
82,46 |
| Blancs et nuls |
165 |
5,99 |
| Exprimés |
2 589 |
94,01 |
*sortant
Canton de Vesoul-Est
Résultats[13]
| Candidats |
Étiquette |
Premier tour |
| Voix |
% |
|
Jean-Claude Ayala * |
UMP |
3 485 |
50,46 |
|
Pierre Emann |
PS |
1 716 |
24,84 |
|
Frédéric Bernabé |
PCF |
1 231 |
17,82 |
|
Simone Levavasseur |
Verts |
475 |
6,88 |
|
| Inscrits |
10 264 |
100,00 |
| Abstentions |
3 064 |
29,85 |
| Votants |
7 200 |
70,15 |
| Blancs et nuls |
293 |
4,07 |
| Exprimés |
6 907 |
95,93 |
*sortant
Canton de Villersexel
Résultats[14]
| Candidats |
Étiquette |
Premier tour |
| Voix |
% |
|
Gérard Pelleteret * |
DVG |
2 952 |
64,15 |
|
Jérôme Mathy |
UMP |
1 139 |
24,75 |
|
Michel Marain |
FN |
511 |
11,10 |
|
| Inscrits |
5 720 |
100,00 |
| Abstentions |
883 |
15,44 |
| Votants |
4 837 |
84,56 |
| Blancs et nuls |
235 |
4,86 |
| Exprimés |
4 602 |
95,14 |
*sortant
Canton de Vitrey-sur-Mance
Résultats[15]
| Candidats |
Étiquette |
Premier tour |
Second tour |
| Voix |
% |
Voix |
% |
|
Serge Deroy |
UMP |
766 |
47,05 |
806 |
51,77 |
|
Catherine Dutruch |
DVG |
702 |
43,12 |
751 |
48,23 |
|
Denis Vignardet |
DVD |
160 |
9,83 |
|
| Inscrits |
2 015 |
100,00 |
2 007 |
100,00 |
| Abstentions |
293 |
14,54 |
396 |
19,73 |
| Votants |
1 722 |
85,46 |
1 611 |
80,27 |
| Blancs et nuls |
94 |
5,46 |
54 |
3,35 |
| Exprimés |
1 628 |
94,54 |
1 557 |
96,65 |
*sortant
Canton de Saint-Sauveur
Résultats[16]
| Candidats |
Étiquette |
Premier tour |
Second tour |
| Voix |
% |
Voix |
% |
|
Joël Daval |
DVG |
2 615 |
47,32 |
2 554 |
54,62 |
|
Sylvie Lassauge |
UMP |
2 179 |
39,43 |
2 122 |
45,38 |
|
Patrice Jaffray |
FN |
732 |
13,25 |
|
| Inscrits |
7 649 |
100,00 |
7 648 |
100,00 |
| Abstentions |
1 737 |
22,71 |
2 705 |
35,37 |
| Votants |
5 912 |
77,29 |
4 943 |
64,63 |
| Blancs et nuls |
386 |
6,53 |
267 |
5,40 |
| Exprimés |
5 526 |
93,47 |
4 676 |
94,60 |
*sortant
Voir aussi
Liens externes
 Portail de la Haute-Saône
  Portail des années 2000
  Portail de la politique française