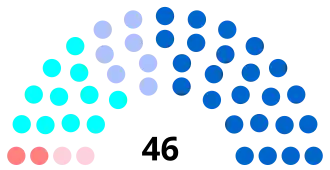
Résultats à l'échelle du département
Résultats par nuances du ministère de l'Intérieur
Les nuances utilisées par le ministère de l'Intérieur ne tiennent pas compte des alliances locales.
Résultats du département[3]
| Binômes |
Premier tour |
Second tour |
Sièges |
|---|
| Voix |
% |
Voix |
% |
|
Union de la droite |
64 929 |
34,13 |
93 160 |
49,86 |
40 |
|
UMP |
5 059 |
2,66 |
6 197 |
3,32 |
2 |
|
DVD |
3 024 |
1,59 |
|
| Droite |
73 012 |
38,38 |
99 357 |
53,18 |
42 |
|
|
Union de la gauche |
48 877 |
25,69 |
39 852 |
21,33 |
4 |
|
FG |
7 339 |
3,86 |
|
EELV |
7 228 |
3,80 |
|
DVG |
566 |
0,30 |
| Gauche |
64 010 |
33,65 |
39 852 |
21,33 |
4 |
|
|
FN |
52 981 |
27,85 |
47 647 |
25,50 |
0 |
|
|
Divers |
261 |
0,14 |
|
| Inscrits |
402 473 |
100,00 |
402 477 |
100,00 |
| Abstentions |
205 283 |
51,01 |
202 578 |
50,33 |
| Votants |
197 190 |
48,99 |
199 899 |
49,67 |
| Blancs |
5 045 |
2,56 |
9 577 |
4,79 |
| Nuls |
1 881 |
0,95 |
3 466 |
1,73 |
| Exprimés |
190 264 |
96,49 |
186 856 |
93,48 |
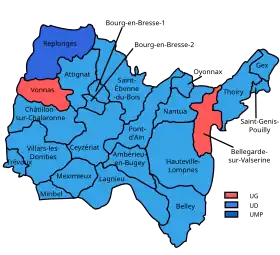
Résultats par canton
* Conseillers généraux sortants ne se représentant pas
Résultats par canton
Canton d'Ambérieu-en-Bugey
Résultats de l'élection départementale des 22 et 29 mars 2015 du canton d'Ambérieu-en-Bugey[4]
| Candidats |
Partis |
Premier tour |
Second tour |
| Voix |
% |
Voix |
% |
| 1 |
Sandrine Castellano |
|
UDI |
2 572 |
28,39 |
4 855 |
58,59 |
| Christophe Fortin |
|
UDI |
| 2 |
Christine Bresson |
|
PCF[5] |
684 |
7,55 |
|
| Patrice Robert |
|
PCF[5] |
| 3 |
Emmanuelle Boudib |
|
DVE[6] |
735 |
8,11 |
| Jean Navarro |
|
EÉLV[6] |
| 4 |
Nadège Pagneux |
|
FN[7] |
2 959 |
32,67 |
3 432 |
41,41 |
| Jean-Pierre Vergnault |
|
FN[7] |
| 5 |
Gilbert Bouchon* |
|
DVG |
2 108 |
23,27 |
|
| Catherine Pidoux |
|
PRG |
|
|
| Inscrits |
19 027 |
100,00 |
19 027 |
100,00 |
| Abstentions |
9 588 |
50,39 |
9 516 |
50,01 |
| Votants |
9 439 |
49,61 |
9 511 |
49,99 |
| Blancs |
281 |
2,98 |
813 |
4,27 |
| Nuls |
100 |
1,06 |
411 |
2,16 |
| Exprimés |
9 058 |
95,96 |
8 287 |
87,13 |
| * conseiller sortant |
Canton d'Attignat
Résultats de l'élection départementale des 22 et 29 mars 2015 du canton d'Attignat[8]
| Candidats |
Partis |
Premier tour |
Second tour |
| Voix |
% |
Voix |
% |
| 1 |
Clotilde Fournier |
|
UDI |
3 183 |
37,48 |
4 038 |
43,56 |
| Walter Martin |
|
UMP |
| 2 |
Virginie Gagneux |
|
FN[7] |
2 465 |
29,03 |
2 191 |
23,64 |
| Yves Philippe |
|
FN[7] |
| 3 |
Mireille Broyer |
|
DVG |
2 844 |
33,49 |
3 040 |
32,80 |
| Jean-Pierre Roche* |
|
DVG |
|
|
| Inscrits |
16 739 |
100,00 |
16 741 |
100,00 |
| Abstentions |
7 820 |
46,72 |
7 202 |
43,02 |
| Votants |
8 919 |
53,28 |
9 539 |
56,98 |
| Blancs |
330 |
3,70 |
196 |
1,17 |
| Nuls |
97 |
1,09 |
74 |
0,44 |
| Exprimés |
8 492 |
95,21 |
9 269 |
97,17 |
| * conseiller sortant |
Canton de Bellegarde-sur-Valserine
Résultats de l'élection départementale des 22 et 29 mars 2015 du canton de Bellegarde-sur-Valserine[9]
| Candidats |
Partis |
Premier tour |
Second tour |
| Voix |
% |
Voix |
% |
| 1 |
Myriam Bouvet-Multon |
|
DVG |
2 930 |
53,08 |
3 616 |
68,71 |
| Guy Larmanjat* |
|
PS |
| 2 |
Élodie Martin |
|
FN[7] |
1 525 |
27,63 |
1 647 |
31,29 |
| Patrick Sokolowski |
|
FN[7] |
| 3 |
Nelly Guinchard |
|
DVD |
1 065 |
19,29 |
|
| David Houzé |
|
UMP |
|
|
| Inscrits |
12 773 |
100,00 |
12 773 |
100,00 |
| Abstentions |
7 030 |
55,04 |
7 145 |
55,94 |
| Votants |
5 743 |
44,96 |
5 628 |
44,06 |
| Blancs |
167 |
2,91 |
285 |
2,23 |
| Nuls |
56 |
0,98 |
80 |
0,63 |
| Exprimés |
5 520 |
96,12 |
5 263 |
41,20 |
| * conseiller sortant |
Canton de Belley
Résultats de l'élection départementale des 22 et 29 mars 2015 du canton de Belley[10]
| Candidats |
Partis |
Premier tour |
Second tour |
| Voix |
% |
Voix |
% |
| 1 |
Jean-Marc Fognini* |
|
PS |
2 855 |
31,09 |
3 769 |
38,29 |
| Pascale Guillon* |
|
DVG |
| 2 |
Patrick Marié |
|
FN[7] |
2 474 |
26,94 |
2 057 |
20,90 |
| Jocelyne Mayet |
|
FN[7] |
| 3 |
Françoise Orsaz |
|
PCF[5] |
733 |
7,98 |
|
| Yves Thoumine |
|
PCF[5] |
| 4 |
Jean-Yves Hédon |
|
UMP |
3 122 |
33,99 |
4 018 |
40,82 |
| Carène Tardy |
|
DVD |
|
|
| Inscrits |
16 868 |
100,00 |
16 868 |
100,00 |
| Abstentions |
7 287 |
43,20 |
6 696 |
39,70 |
| Votants |
9 581 |
56,80 |
6 696 |
60,30 |
| Blancs |
299 |
3,12 |
237 |
2,33 |
| Nuls |
98 |
1,02 |
91 |
0,89 |
| Exprimés |
9 184 |
95,86 |
9 844 |
96,78 |
| * conseiller sortant |
Canton de Bourg-en-Bresse-1
Résultats de l'élection départementale des 22 et 29 mars 2015 du canton de Bourg-en-Bresse-1[11]
| Candidats |
Partis |
Premier tour |
Second tour |
| Voix |
% |
Voix |
% |
| 1 |
Françoise Courtine |
|
PS |
3 243 |
34,56 |
3 990 |
43,02 |
| Guillaume Lacroix* |
|
PRG |
| 2 |
Jérôme Buisson |
|
FN[7] |
1 723 |
18,36 |
|
| Nicole Possoz |
|
FN[7] |
| 3 |
Hélène Maréchal |
|
UMP |
3 949 |
42,08 |
5 285 |
56,98 |
| Bernard Perret |
|
DVD |
| 4 |
Martine Bouilloux |
|
PCF[5] |
469 |
5,00 |
|
| Jean Leclair |
|
PCF[5] |
|
|
| Inscrits |
19 929 |
100,00 |
19 931 |
100,00 |
| Abstentions |
10 304 |
51,7 |
10 202 |
51,19 |
| Votants |
9 625 |
48,3 |
9 729 |
48,81 |
| Blancs |
163 |
1,69 |
304 |
3,12 |
| Nuls |
78 |
0,81 |
150 |
1,54 |
| Exprimés |
9 384 |
97,5 |
9 275 |
95,33 |
| * conseiller sortant |
Canton de Bourg-en-Bresse-2
Résultats de l'élection départementale des 22 et 29 mars 2015 du canton de Bourg-en-Bresse-2[12]
| Candidats |
Partis |
Premier tour |
Second tour |
| Voix |
% |
Voix |
% |
| 1 |
Daniel Blatrix |
|
PCF[5] |
562 |
6,72 |
|
| Catherine Maître |
|
PCF[5] |
| 2 |
Hélène Cedileau |
|
DVD |
3 075 |
36,79 |
4 409 |
53,13 |
| Pierre Lurin |
|
UMP |
| 3 |
Anthony Chevrel |
|
FN[7] |
1 732 |
20,72 |
|
| Andrée Philippe |
|
FN[7] |
| 4 |
Cécile Bernard |
|
PS |
2 990 |
35,77 |
3 890 |
46,87 |
| Michel Fontaine |
|
PS |
|
|
| Inscrits |
17 303 |
100,00 |
17 304 |
100,00 |
| Abstentions |
8 629 |
49,87 |
8 476 |
48,98 |
| Votants |
8 674 |
50,13 |
8 828 |
51,02 |
| Blancs |
203 |
2,34 |
361 |
4,09 |
| Nuls |
112 |
1,29 |
168 |
1,9 |
| Exprimés |
8 359 |
96,37 |
8 299 |
94,01 |
Canton de Ceyzériat
Résultats de l'élection départementale des 22 et 29 mars 2015 du canton de Ceyzériat[13]
| Candidats |
Partis |
Premier tour |
Second tour |
| Voix |
% |
Voix |
% |
| 1 |
Jean-Yves Flochon* |
|
UMP |
3 213 |
34,78 |
4 014 |
41,51 |
| Martine Tabouret |
|
DVD |
| 2 |
Rachel Mazuir* |
|
PS |
2 345 |
25,39 |
2 906 |
30,05 |
| Marie-Claire Panabières |
|
DVG |
| 3 |
Jean-Pierre Bouilloux |
|
PCF[5] |
362 |
3,92 |
|
| Catherine Groslon |
|
PCF[5] |
| 4 |
Lucie Novelli |
|
EÉLV |
514 |
5,56 |
| Jean-Luc Roux |
|
EÉLV[6] |
| 5 |
Roxane Chaudesaigues |
|
FN[7] |
2 803 |
30,35 |
2 750 |
28,44 |
| Didier Girard |
|
FN[7] |
|
|
| Inscrits |
17 838 |
100,00 |
17 838 |
100,00 |
| Abstentions |
8 327 |
46,68 |
7 840 |
43,95 |
| Votants |
9 511 |
53,32 |
9 998 |
56,05 |
| Blancs |
202 |
2,12 |
239 |
2,39 |
| Nuls |
72 |
0,76 |
89 |
0,89 |
| Exprimés |
9 237 |
97,12 |
9 670 |
96,72 |
| * conseiller sortant |
Canton de Châtillon-sur-Chalaronne
Résultats de l'élection départementale des 22 et 29 mars 2015 du canton de Châtillon-sur-Chalaronne[14]
| Candidats |
Partis |
Premier tour |
Second tour |
| Voix |
% |
Voix |
% |
| 1 |
Oriane Blatrix |
|
DVE[6] |
645 |
6,65 |
|
| Nicolas Zielinski |
|
EÉLV[6] |
| 2 |
Yves Clayette* |
|
UMP |
3 884 |
40,07 |
5 706 |
60,7 |
| Muriel Luga Giraud |
|
UDI |
| 3 |
Maxime Chaussat |
|
FN[7] |
3 374 |
34,81 |
3 695 |
39,3 |
| Aimée Simian |
|
FN[7] |
| 4 |
Renaud Drouy |
|
DVG |
1 791 |
18,48 |
|
| Marie-Christine Hyvernat |
|
DVG |
|
|
| Inscrits |
20 426 |
100,00 |
20 427 |
100,00 |
| Abstentions |
10 369 |
50,76 |
10 227 |
50,07 |
| Votants |
10 057 |
49,24 |
10 200 |
49,93 |
| Blancs |
271 |
2,69 |
631 |
6,19 |
| Nuls |
92 |
0,91 |
168 |
1,65 |
| Exprimés |
9 694 |
96,39 |
9 401 |
92,17 |
| * conseiller sortant |
Canton de Gex
Résultats de l'élection départementale des 22 et 29 mars 2015 du canton de Gex[15]
| Candidats |
Partis |
Premier tour |
Second tour |
| Voix |
% |
Voix |
% |
| 1 |
Frédéric Dumont-Girard |
|
EÉLV |
978 |
15,88 |
|
| Karin Nourrisse |
|
DVE[6] |
| 2 |
Claire de Mauduit |
|
FN[7] |
1 183 |
19,21 |
1 230 |
20,83 |
| Florian Feller |
|
FN[7] |
| 3 |
Chloé Baissat |
|
DVG |
873 |
14,17 |
|
| Henri Rédier de La Villatte |
|
PS |
| 4 |
Véronique Baude |
|
UMP |
3 125 |
50,74 |
4 675 |
79,17 |
| Gérard Paoli |
|
UDI |
|
|
| Inscrits |
16 657 |
100,00 |
16 657 |
100,00 |
| Abstentions |
10 330 |
62,02 |
10 305 |
61,87 |
| Votants |
6 327 |
37,98 |
6 352 |
38,13 |
| Blancs |
108 |
1,71 |
317 |
4,99 |
| Nuls |
60 |
0,95 |
130 |
2,05 |
| Exprimés |
6 159 |
97,34 |
5 905 |
92,96 |
Canton d'Hauteville-Lompnes
Résultats de l'élection départementale des 22 et 29 mars 2015 du canton d'Hauteville-Lompnes[16]
| Candidats |
Partis |
Premier tour |
Second tour |
| Voix |
% |
Voix |
% |
| 1 |
Philippe Emin |
|
UMP |
2 770 |
35,71 |
4 330 |
63,08 |
| Annie Meuriau |
|
UDI |
| 2 |
Gaëlle Foray |
|
PCF[5] |
1 092 |
14,08 |
|
| Philippe Virard |
|
PCF[5] |
| 3 |
Nathalie Martinez |
|
FN[7] |
2 295 |
29,59 |
2 534 |
36,92 |
| Patrick Saint-Mars |
|
FN[7] |
| 4 |
Jacques Rabut* |
|
DVG |
1 599 |
20,62 |
|
| Caroline Rollinson |
|
DVG |
|
|
| Inscrits |
15 242 |
|
15 235 |
100,00 |
| Abstentions |
7 198 |
47,22 |
7 363 |
48,33 |
| Votants |
8 044 |
52,78 |
7 872 |
51,67 |
| Blancs |
208 |
2,59 |
759 |
9,64 |
| Nuls |
80 |
0,99 |
249 |
3,16 |
| Exprimés |
7 756 |
96,42 |
6 864 |
87,2 |
| * conseiller sortant |
Canton de Lagnieu
Résultats de l'élection départementale des 22 et 29 mars 2015 du canton de Lagnieu[17]
| Candidats |
Partis |
Premier tour |
Second tour |
| Voix |
% |
Voix |
% |
| 1 |
Caroline Barnay |
|
DVE[6] |
783 |
7,16 |
|
| Philippe Chabbouh |
|
EÉLV[6] |
| 2 |
Daniel Béguet* |
|
DVG |
2 057 |
18,80 |
| Béatrice Dalmaz |
|
DVG |
| 3 |
Annick Prieur |
|
FN[7] |
3 289 |
30,07 |
3 360 |
32,99 |
| Georges Sigrist |
|
FN[7] |
| 4 |
Charles de La Verpillière* |
|
UMP |
4 810 |
43,97 |
6 825 |
67,01 |
| Viviane Vaudray |
|
DVD |
|
|
| Inscrits |
23 105 |
100,00 |
23 112 |
100,00 |
| Abstentions |
11 783 |
51 |
12 020 |
52,01 |
| Votants |
11 322 |
49 |
11 092 |
47,99 |
| Blancs |
273 |
2,41 |
677 |
6,1 |
| Nuls |
110 |
0,97 |
230 |
2,07 |
| Exprimés |
10 939 |
96,62 |
10 185 |
91,82 |
| * conseiller sortant |
Canton de Meximieux
Résultats de l'élection départementale des 22 et 29 mars 2015 du canton de Meximieux[18]
| Candidats |
Partis |
Premier tour |
Second tour |
| Voix |
% |
Voix |
% |
| 1 |
Nicole de Lacheisserie |
|
FN[7] |
3 072 |
31,30 |
3 465 |
39,02 |
| Yves Prieur |
|
FN[7] |
| 2 |
Romain Daubié |
|
UMP |
2 639 |
26,89 |
5 415 |
60,98 |
| Élisabeth Laroche |
|
UMP |
| 3 |
Jacky Bernard |
|
PS |
1 772 |
18,05 |
|
| Fabienne Lalance |
|
DVG |
| 4 |
Albane Colin |
|
EÉLV[6] |
722 |
7,36 |
| Paul Vernay |
|
EÉLV[6] |
| 5 |
Nicole Motte-Sapaly |
|
PCF[5] |
508 |
5,18 |
| François Truc |
|
PCF[5] |
| 6 |
Gilles Marand |
|
DVD |
1 102 |
11,23 |
| Nathalie Vaudan |
|
DVD |
|
|
| Inscrits |
20 622 |
100,00 |
20 623 |
100,00 |
| Abstentions |
10 546 |
51,14 |
10 605 |
51,42 |
| Votants |
10 076 |
48,86 |
10 018 |
48,58 |
| Blancs |
200 |
1,98 |
830 |
8,29 |
| Nuls |
61 |
0,61 |
308 |
3,07 |
| Exprimés |
9 815 |
97,41 |
8 880 |
88,64 |
Canton de Miribel
Résultats de l'élection départementale des 22 et 29 mars 2015 du canton de Miribel[19]
| Candidats |
Partis |
Premier tour |
Second tour |
| Voix |
% |
Voix |
% |
| 1 |
Josiane Bouvier |
|
PS |
2 790 |
31,74 |
3 554 |
37,14 |
| Pierre Goubet* |
|
DVG |
| 2 |
Patrice Gobet |
|
FN[7] |
2 605 |
29,64 |
2 336 |
24,41 |
| Patricia Labrosse |
|
FN[7] |
| 3 |
Jean-Pierre Gaitet |
|
UMP |
2 855 |
32,48 |
3 678 |
38,44 |
| Caroline Terrier |
|
UMP |
| 4 |
Albert Belthier |
|
PCF[5] |
540 |
6,14 |
|
| Arlette Orsaz |
|
PCF[5] |
|
|
| Inscrits |
19 438 |
100,00 |
19 438 |
100,00 |
| Abstentions |
10 390 |
53,45 |
9 627 |
49,53 |
| Votants |
9 048 |
46,55 |
9 811 |
50,47 |
| Blancs |
198 |
2,19 |
186 |
1,9 |
| Nuls |
60 |
0,66 |
57 |
0,58 |
| Exprimés |
8 790 |
97,15 |
9 568 |
97,52 |
| * conseiller sortant |
Canton de Nantua
Résultats de l'élection départementale des 22 et 29 mars 2015 du canton de Nantua[20]
| Candidats |
Partis |
Premier tour |
Second tour |
| Voix |
% |
Voix |
% |
| 1 |
Kamel Hassoun |
|
DVG |
1 092 |
18,25 |
|
| Claude Mercier |
|
DVG |
| 2 |
Morgan Benoît |
|
FN[7] |
1 858 |
31,05 |
1 839 |
32,08 |
| Valérie Berthaud |
|
FN[7] |
| 3 |
Jean Deguerry* |
|
UMP |
3 033 |
50,69 |
3 893 |
67,92 |
| Natacha Lorillard |
|
UMP |
|
|
| Inscrits |
13 149 |
100,00 |
13 149 |
100,00 |
| Abstentions |
6 873 |
52,27 |
6 990 |
53,16 |
| Votants |
6 276 |
47,73 |
6 159 |
46,84 |
| Blancs |
197 |
3,14 |
338 |
5,49 |
| Nuls |
96 |
1,53 |
89 |
1,45 |
| Exprimés |
5 983 |
95,33 |
5 732 |
93,07 |
| * conseiller sortant |
Canton d'Oyonnax
Résultats de l'élection départementale des 22 et 29 mars 2015 du canton d'Oyonnax[21]
| Candidats |
Partis |
Premier tour |
Second tour |
| Voix |
% |
Voix |
% |
| 1 |
Georges Arpin |
|
PCF[5] |
830 |
15,66 |
|
| Mylène Ferri |
|
PCF[5] |
| 2 |
Marie-France Buhler |
|
FN[7] |
1 505 |
28,39 |
1 764 |
34,53 |
| Claude Promonet |
|
FN[7] |
| 3 |
Liliane Maissiat |
|
UDI |
2 359 |
44,5 |
3 344 |
65,47 |
| Michel Perraud |
|
UDI |
| 4 |
Murielle Brizard |
|
DVD |
607 |
11,45 |
|
| Julien Martinez |
|
DVD |
|
|
| Inscrits |
13 494 |
100,00 |
13 492 |
100,00 |
| Abstentions |
7 988 |
59,2 |
8 030 |
59,52 |
| Votants |
5 506 |
40,8 |
5 462 |
40,48 |
| Blancs |
141 |
2,56 |
240 |
4,39 |
| Nuls |
64 |
1,16 |
114 |
2,09 |
| Exprimés |
5 301 |
96,28 |
5 108 |
93,52 |
Canton de Pont-d'Ain
Résultats de l'élection départementale des 22 et 29 mars 2015 du canton de Pont-d'Ain[22]
| Candidats |
Partis |
Premier tour |
Second tour |
| Voix |
% |
Voix |
% |
| 1 |
Richard Kuta |
|
FN[7] |
2 210 |
28,44 |
2 149 |
26,52 |
| Annick Veillerot |
|
FN[7] |
| 2 |
Anne Bollache |
|
PRG |
2 049 |
26,36 |
2 415 |
29,81 |
| Mario Borroni* |
|
DVG |
| 3 |
Damien Abad |
|
UMP |
3 009 |
38,72 |
3 538 |
43,67 |
| Marie-Christine Chapel |
|
DVD |
| 4 |
Nadia Chanel |
|
PCF[5] |
504 |
6,48 |
|
| Gérard Goulette |
|
PCF[5] |
|
|
| Inscrits |
14 802 |
100,00 |
14 800 |
100,00 |
| Abstentions |
6 777 |
45,78 |
6 526 |
44,09 |
| Votants |
8 025 |
54,22 |
8 274 |
55,91 |
| Blancs |
161 |
2,01 |
127 |
1,53 |
| Nuls |
92 |
1,15 |
45 |
0,54 |
| Exprimés |
7 772 |
96,85 |
8 102 |
97,92 |
| * conseiller sortant |
Canton de Replonges
Résultats de l'élection départementale des 22 et 29 mars 2015 du canton de Replonges[23]
| Candidats |
Partis |
Premier tour |
Second tour |
| Voix |
% |
Voix |
% |
| 1 |
Guy Billoudet* |
|
UMP |
2 614 |
24,91 |
6 197 |
63,88 |
| Valérie Guyon |
|
UMP |
| 2 |
Henri Guillermin* |
|
UMP |
2 445 |
23,30 |
|
| Andrée Tirreau |
|
UMP |
| 3 |
Jean Claude Boucher |
|
EÉLV |
639 |
6,09 |
| Régine Saura-Lacour |
|
EÉLV |
| 4 |
Marie-Louise Marqueyrol |
|
FN[7] |
2 835 |
27,01 |
3 504 |
36,12 |
| David Sevelinge |
|
FN[7] |
| 5 |
Éric Diochon |
|
PS |
1 962 |
18,69 |
|
| Cécile Patriarca |
|
DVG |
|
|
| Inscrits |
21 542 |
100,00 |
21 542 |
100,00 |
| Abstentions |
10 597 |
49,19 |
10 686 |
49,61 |
| Votants |
10 945 |
50,81 |
10 856 |
50,39 |
| Blancs |
324 |
2,96 |
845 |
7,78 |
| Nuls |
126 |
1,15 |
310 |
2,86 |
| Exprimés |
10 495 |
95,89 |
9 701 |
89,36 |
| * conseiller sortant |
Canton de Saint-Étienne-du-Bois
Résultats de l'élection départementale des 22 et 29 mars 2015 du canton de Saint-Étienne-du-Bois[24]
| Candidats |
Partis |
Premier tour |
Second tour |
| Voix |
% |
Voix |
% |
| 1 |
Alain Gestas* |
|
DVG |
2 889 |
32,98 |
3 535 |
38,16 |
| Monique Wiel |
|
DVG |
| 2 |
Gaël Bertrand |
|
FN[7] |
2 182 |
24,91 |
1 943 |
20,98 |
| Nicole Bocaccio |
|
FN[7] |
| 3 |
Nadia Allouache |
|
EÉLV[6] |
639 |
7,30 |
|
| Florian Chambolle |
|
EÉLV[6] |
| 4 |
Alain Chapuis |
|
UDI |
3 049 |
34,81 |
3 785 |
40,86 |
| Catherine Journet |
|
DVD |
|
|
| Inscrits |
16 068 |
100,00 |
16 068 |
100,00 |
| Abstentions |
6 957 |
43,3 |
6 504 |
40,48 |
| Votants |
9 111 |
56,7 |
9 564 |
59,52 |
| Blancs |
266 |
2,92 |
245 |
2,56 |
| Nuls |
86 |
0,94 |
56 |
0,59 |
| Exprimés |
8 759 |
96,14 |
9 263 |
96,85 |
| * conseiller sortant |
Canton de Saint-Genis-Pouilly
Résultats de l'élection départementale des 22 et 29 mars 2015 du canton de Saint-Genis-Pouilly[25]
| Candidats |
Partis |
Premier tour |
Second tour |
| Voix |
% |
Voix |
% |
| 1 |
Rudy Linari |
|
FN[7] |
814 |
16,11 |
|
| Jacqueline Sigrist |
|
FN[7] |
| 2 |
Floriane Leaux |
|
EÉLV[6] |
949 |
18,78 |
| François Meylan |
|
DVG[6] |
| 3 |
Aurélie Charillon |
|
UMP |
2 112 |
41,8 |
2 962 |
61,93 |
| Daniel Raphoz |
|
UDI |
| 4 |
Hubert Bertrand |
|
PRG |
1 178 |
23,31 |
1 821 |
38,07 |
| Géraldine Sacchi-Hassanein |
|
PS |
|
|
| Inscrits |
13 041 |
100,00 |
13 041 |
100,00 |
| Abstentions |
7 868 |
60,33 |
8 029 |
61,57 |
| Votants |
5 173 |
39,67 |
5 012 |
38,43 |
| Blancs |
85 |
1,64 |
159 |
3,17 |
| Nuls |
35 |
0,68 |
70 |
1,4 |
| Exprimés |
5 053 |
97,68 |
4 783 |
95,43 |
Canton de Thoiry
Résultats de l'élection départementale des 22 et 29 mars 2015 du canton de Thoiry[26]
| Candidats |
Partis |
Premier tour |
Second tour |
| Voix |
% |
Voix |
% |
| 1 |
Fanny Gallé |
|
FN[7] |
1 275 |
22,42 |
1 376 |
25,23 |
| Gaëtan Noblet |
|
FN[7] |
| 2 |
Yvette Armand |
|
DVG |
1 163 |
20,45 |
|
| Denis Linglin |
|
PS |
| 3 |
Marie-Josefa Bertrand |
|
DVG |
566 |
9,95 |
| Christian Jolie |
|
DVG |
| 4 |
Muriel Bénier |
|
UMP |
2 683 |
47,18 |
4 078 |
74,77 |
| Michel Brulhart |
|
UMP |
|
|
| Inscrits |
13 863 |
100,00 |
13 863 |
100,00 |
| Abstentions |
7 918 |
57,12 |
7 978 |
57,55 |
| Votants |
5 945 |
42,88 |
5 885 |
42,45 |
| Blancs |
180 |
3,03 |
340 |
5,78 |
| Nuls |
78 |
1,31 |
91 |
1,55 |
| Exprimés |
5 687 |
95,66 |
5 454 |
92,68 |
Canton de Trévoux
Résultats de l'élection départementale des 22 et 29 mars 2015 du canton de Trévoux[27]
| Candidats |
Partis |
Premier tour |
Second tour |
| Voix |
% |
Voix |
% |
| 1 |
Gilbert Colovray |
|
FN[7] |
2 682 |
26,78 |
|
| Anne Michaud |
|
FN[7] |
| 2 |
Nathalie Barde |
|
UDI |
2 800 |
27,96 |
5 235 |
57,54 |
| Marc Pechoux |
|
UMP |
| 3 |
Olivier Eyraud* |
|
DLF[28] |
1 120 |
11,18 |
|
| Jacqueline Fournet |
|
DLF[28] |
| 4 |
Guy Brulland |
|
PCF[5] |
644 |
6,43 |
| Nicole Piola |
|
PCF[5] |
| 5 |
Isabelle Achard |
|
DVG |
2 768 |
27,64 |
3 863 |
42,46 |
| Patrick Rousset* |
|
DVG |
|
|
| Inscrits |
21 523 |
100,00 |
21 525 |
100,00 |
| Abstentions |
11 219 |
52,13 |
11 700 |
54,36 |
| Votants |
10 304 |
47,87 |
9 825 |
45,64 |
| Blancs |
195 |
1,89 |
502 |
5,11 |
| Nuls |
95 |
0,92 |
225 |
2,29 |
| Exprimés |
10 014 |
97,19 |
9 098 |
92,6 |
| * conseiller sortant |
Canton de Villars-les-Dombes
Résultats de l'élection départementale des 22 et 29 mars 2015 du canton de Villars-les-Dombes[29]
| Candidats |
Partis |
Premier tour |
Second tour |
| Voix |
% |
Voix |
% |
| 1 |
Sophie Khieu |
|
DLF[28] |
195 |
1,81 |
|
| Émilien Sermet |
|
DLF[28] |
| 2 |
Rémi Charbonnel |
|
PCF[5] |
411 |
3,82 |
| Catherine Lattard |
|
PCF[5] |
| 3 |
Claude Fortin |
|
SE |
261 |
2,42 |
| Nicole Gagnaire |
|
SE |
| 4 |
Gilles Garaudet |
|
EÉLV[6] |
624 |
5,80 |
| Anne Partensky-Leibman |
|
EÉLV[6] |
| 5 |
Henri Cormorèche |
|
UDI |
3 201 |
29,74 |
6 232 |
59,58 |
| Brigitte Coulon |
|
UMP |
| 6 |
Pénélope Chalon |
|
FN[7] |
3 711 |
34,48 |
4 228 |
40,42 |
| Laurent Sugy |
|
FN[7] |
| 7 |
Georges Faverjon* |
|
DVG |
2 361 |
21,93 |
|
| Christine Gonnu* |
|
PS |
|
|
| Inscrits |
22 925 |
100,00 |
22 926 |
100,00 |
| Abstentions |
11 792 |
51,44 |
11 522 |
50,26 |
| Votants |
11 133 |
48,56 |
11 404 |
49,74 |
| Blancs |
296 |
2,66 |
732 |
6,42 |
| Nuls |
73 |
0,66 |
212 |
1,86 |
| Exprimés |
10 764 |
96,69 |
10 460 |
91,72 |
| * conseiller sortant |
Canton de Vonnas
Résultats de l'élection départementale des 22 et 29 mars 2015 du canton de Vonnas[30]
| Candidats |
Partis |
Premier tour |
Second tour |
| Voix |
% |
Voix |
% |
| 1 |
Christophe Greffet* |
|
PS |
3 217 |
39,98 |
3 453 |
40,89 |
| Mireille Louis |
|
DVG |
| 2 |
Blanche Chaussat |
|
FN[7] |
2 410 |
29,95 |
2 147 |
25,42 |
| Edmond Marqueyrol |
|
FN[7] |
| 3 |
Marie-Andrée Clément |
|
DVD |
2 420 |
30,07 |
2 845 |
33,69 |
| Michel Voisin |
|
UMP |
|
|
| Inscrits |
16 099 |
100,00 |
16 098 |
100,00 |
| Abstentions |
7 693 |
47,79 |
7 390 |
45,91 |
| Votants |
8 406 |
52,21 |
8 708 |
54,09 |
| Blancs |
274 |
3,26 |
214 |
2,46 |
| Nuls |
85 |
1,01 |
49 |
0,56 |
| Exprimés |
8 047 |
95,73 |
8 445 |
96,98 |
| * conseiller sortant |
Notes et références
 Portail de l’Ain
  Portail des années 2010
  Portail de la politique française